Gemini: Yes, tourists can legally buy cannabis in New York. New York State’s adult-use cannabis laws do not require state residency or a medical card.
The essential legal rules and practical requirements for visitors buying cannabis in New York state:
Requirements & Limits
Age & Identification: You must be 21 or older. You only need a valid government-issued photo ID (a driver’s license from any U.S. state, a U.S. passport, or a foreign passport).
Possession Limits: Adults 21+ can legally buy and carry up to 3 ounces (85 grams) of cannabis flower or up to 24 grams of concentrated cannabis (such as vapes, edibles, or extracts).
Payment: Federal banking laws restrict standard credit card processing, so most licensed dispensaries operate on cash or debit card (most stores have ATMs on-site).
Shopping Safely
Buy Licensed: Make sure you buy from a state-licensed adult-use dispensary. Licensed stores display an official New York State Dispensary Verification Sticker near the entrance and sell lab-tested products. Avoid unlicensed smoke shops or convenience stores.
Where You Can & Cannot Use It
Where to Consume: Public consumption is allowed generally anywhere tobacco smoking is permitted (e.g., public sidewalks).
Prohibited Areas: You cannot consume cannabis in public parks, beaches, restaurants, public transit (subways/buses), federal land, or inside vehicles.
Hotels & Rentals: Most hotels and short-term rentals strictly ban smoking or vaping indoors.
Important Travel Note: Federal law strictly prohibits taking cannabis across state lines or onto airplanes—even if you are traveling to another state or country where cannabis is legal. Keep all purchases within New York State.
Question: What about in Montana?
Gemini:Yes, tourists can legally buy recreational cannabis in Montana. Anyone 21 or older with a valid government-issued photo ID (a driver’s license from any state or a passport) can make a purchase.
However, there are a few important state-specific rules and geographic exceptions to keep in mind:
1. The «Green vs. Red» County System
Unlike New York, where dispensaries can open anywhere state regulations permit, Montana allows individual counties to ban recreational sales.
«Green» Counties: Adult-use sales are legal. Major tourist destinations like Missoula, Bozeman (Gallatin County), Whitefish/Kalispell (Flathead County), and Helena allow recreational dispensaries.
«Red» Counties: Local voters opted out, so recreational sales are prohibited there (though medical dispensaries may still operate for state cardholders). Always double-check dispensary availability in the specific town you are visiting.
2. Purchase & Possession Limits
In a single transaction, adult consumers can purchase up to:
1 ounce (28 grams) of cannabis flower, OR
8 grams of concentrates/vapes, OR
800 milligrams of THC in edibles
(Note: State law caps individual edible packages at 100 mg THC, with a single serving restricted to 5–10 mg THC).
3. Taxes & Payment
Recreational purchases are subject to a 20% state sales tax, and some individual counties add a local option tax of up to 3% on top of that. Most dispensaries operate cash-only or debit via an on-site ATM.
4. Strict Public & Federal Rules (Crucial for Tourists)
Private Property Only: Montana law limits cannabis consumption strictly to private property. Public consumption (on sidewalks, streets, or parks) is illegal.
No Federal Lands / National Parks: This is the biggest trap for visitors in Montana. Federal law strictly bans cannabis on federal property. Bringing or consuming cannabis inside Glacier National Park, Yellowstone National Park, or surrounding National Forest lands is a federal offense.
Driving: Cannabis must be kept in sealed child-proof packaging and out of reach of the driver while operating a vehicle.
Zürcher Kantonalbank (ZKB) is indeed a significant institution—it is the largest cantonal bank in Switzerland and the third-largest bank overall in the country, trailing only the UBS entities and the Raiffeisen group.
ZKB Headquarters in Zurich. Bron: Zürcher Kantonalbank
What Makes ZKB So Large and Unique
Balance Sheet Size: With over CHF 200 billion in total assets and client assets under management exceeding CHF 450 billion, ZKB operates on a scale larger than most national banks in smaller European countries.
Systemically Important Bank (SIB): The Swiss Financial Market Supervisory Authority (FINMA) and the Swiss National Bank officially designate ZKB as one of Switzerland’s domestic systemically important banks («Too Big to Fail»), subjecting it to strict capital and liquidity requirements.
State Guarantee (Staatsgarantie): ZKB is 100% owned by the Canton of Zurich. Under cantonal law, the Canton of Zurich guarantees all of ZKB’s liabilities. If the bank were ever unable to meet its obligations, the taxpayers of Zurich cover the shortfall.
Top Credit Ratings: Because of its financial health and the full backing of Switzerland’s wealthiest canton, ZKB consistently receives AAA / Aaa credit ratings from major rating agencies (Standard & Poor’s, Moody’s, and Fitch)—a higher rating than almost all private commercial banks globally.
Regional Concentration: Despite its size, ZKB operates primarily within the Greater Zurich Area and Switzerland, functioning as a primary lender for local mortgages, small business financing, and regional retail banking, alongside a substantial asset management arm.
Is it true that governments like to write out even 30 year bonds?
Yes, it is true. Sovereign governments frequently issue 30-year bonds (and sometimes even longer maturities like 50-year or 100-year «ultra-long» bonds) as a core tool for managing national debt and public finance.
The US Treasury, the UK (which calls them gilts), France, Germany, Japan, and many other governments regularly auction 30-year paper.
Why Governments Issue 30-Year Bonds
Locking in Borrowing Costs for Decades: By issuing ultra-long debt, a government locks in a fixed interest rate (coupon) for 30 years. If interest rates are low, this allows debt management offices to fund long-term commitments cheaply without having to refinance every few years.
Matching Infrastructure Horizons: Governments finance long-term public assets—such as national railways, bridges, power grids, and defense infrastructure—that yield benefits over several decades. Paying off those assets over a 30-year horizon aligns the life of the asset with the financing term.
Reducing Refinancing Risk: If a government relies exclusively on 2-year or 5-year bonds, it has to constantly issue new debt to pay off maturing debt («rollover risk»). Spreading debt maturity out to 30 years means a smaller percentage of national debt comes due in any single year.
Satisfying Institutional Demand (Pension Funds & Insurers): Life insurance companies and pension funds have long-term liabilities—they need to pay out pensions to retirees 20 to 40 years in the future. They actively demand ultra-long government bonds because these risk-free assets guarantee fixed cash flows that match their long-term obligation timelines.
Do Governments Ever Issue Longer Than 30 Years?
Yes. While 30 years is the standard benchmark for long-term sovereign debt, several countries have gone even further:
50-Year Bonds: Issued by countries like France, Italy, Spain, and the UK.
100-Year Bonds (Century Bonds): Austria famously issued 100-year bonds in 2017 and 2020 at record-low interest rates (~0.88% to 1.2%). Mexico, Argentina, and Ireland have also experimented with 100-year debt.
Trade-offs for the Government
Higher Interest Rates (Term Premium): Under normal economic conditions, investors demand a slightly higher yield (interest rate) to tie up their money for 30 years compared to 5 or 10 years.
Inflation Risk for Investors: 30 years is a long time for inflation to erode purchasing power, making long-term bonds particularly sensitive to changing interest rate environments.
Can you make a list of the top 25 countries that get like the lowest interest they have to pay over 30 year bonds?
The interest rate a country pays on its 30-year government bonds (its 30-year bond yield) reflects market expectations of long-term inflation, currency stability, economic growth, and sovereign default risk.
Governments with strong fiscal discipline, low inflation, and highly stable currencies pay the lowest interest rates. Below is a table ranking 25 major countries with the lowest 30-year government bond yields, ordered from lowest borrowing cost to higher.
Top 25 Countries with the Lowest 30-Year Bond Yields
Rank
Country
Approx. 30Y Bond Yield (%)
Currency
Primary Driving Factors
1
Switzerland
0.8% – 1.2%
CHF
Exceptionally low inflation, strong Swiss Franc, «safe haven» capital inflow.
2
China
2.0% – 2.3%
CNY
Low domestic inflation, strong domestic bank demand for long-term debt.
3
Taiwan
2.0% – 2.4%
TWD
High domestic savings rate, persistent current account surplus.
4
Thailand
2.6% – 2.9%
THB
Low inflation, high central bank reserve accumulation.
5
Denmark
2.9% – 3.2%
DKK
AAA credit rating, currency pegged to Euro, robust fiscal position.
6
Sweden
3.0% – 3.3%
SEK
Low sovereign debt-to-GDP ratio, strong fiscal framework.
7
Singapore
3.0% – 3.4%
SGD
AAA credit rating, massive sovereign wealth funds (GIC/Temasek).
8
Germany
3.3% – 3.6%
EUR
The Eurozone’s AAA benchmark safe-haven asset (Bunds).
9
Netherlands
3.3% – 3.6%
EUR
AAA credit rating, strong institutional pension fund demand.
AA+ rated core Eurozone issuer with high institutional demand.
12
Portugal
3.6% – 3.9%
EUR
Massive fiscal turnaround and rapid debt reduction over recent years.
13
Finland
3.6% – 3.9%
EUR
High credit quality and stable European institutional integration.
14
Canada
3.6% – 4.0%
CAD
AAA sovereign rating, large domestic institutional market.
15
Spain
3.8% – 4.1%
EUR
Robust post-pandemic GDP growth offsetting higher debt levels.
16
Belgium
3.8% – 4.1%
EUR
Core Eurozone economy with strong domestic household wealth.
17
Japan
3.8% – 4.1%
JPY
Yields have risen from historical zero levels due to Bank of Japan policy normalization.
18
South Korea
4.0% – 4.3%
KRW
Solid macroeconomic fundamentals, though yields reflect higher short-term rates.
19
Israel
4.1% – 4.5%
ILS
Strong tech-driven economy, though risk premiums fluctuate with regional events.
20
France
4.3% – 4.7%
EUR
Large liquid market, though political budget debates have added a small premium.
21
Italy
4.4% – 4.8%
EUR
Higher national debt ratio requires offering higher yields to attract buyers.
22
United Kingdom
4.8% – 5.1%
GBP
Higher inflation stickiness and heavy gilt supply pushing up yields.
23
United States
5.0% – 5.3%
USD
Massive government deficit spending and heavy Treasury issuance elevating term premiums.
24
New Zealand
5.0% – 5.3%
NZD
Smaller market size with yields closely linked to global capital costs.
25
Australia
5.1% – 5.4%
AUD
AAA sovereign rating, but higher domestic cash rates drive long-term yields up.
What Enables a Country to Borrow Cheaply for 30 Years?
Low Structural Inflation: A 30-year bond’s fixed return can easily be wiped out by inflation. Investors in Swiss or Danish debt accept tiny yields because they trust those currencies will hold purchasing power over decades.
Local Institutional Demand: Countries with massive private pension funds or life insurance sectors (e.g., the Netherlands, Switzerland, Singapore) have a guaranteed domestic buyer base that must hold ultra-long government paper to match future retirement payouts.
Fiscal Reserve Rules: Nations with strict debt-limit laws or massive sovereign wealth reserves carry virtually zero default risk, lowering the premium investors demand.
Gemini: The largest banks in Switzerland, ranked by total assets on their balance sheet, are listed below:
Rank
Bank Name
Category / Type
Total Assets (CHF Billion)
1
UBS AG
Major Bank
628.3
2
UBS Switzerland AG
Major Bank (Retail/Domestic)
500.7
3
Raiffeisen Switzerland
Cooperative Banking Group
323.0
4
Zürcher Kantonalbank (ZKB)
Cantonal Bank
206.2
5
PostFinance AG
Financial Services (Swiss Post)
104.4
6
Pfandbriefbank
Specialized Mortgage Bond Institution
102.9
7
Bank Julius Bär & Co. AG
Wealth Management / Private Bank
101.7
8
Migros Bank AG
Retail Bank
62.3
9
Luzerner Kantonalbank AG
Cantonal Bank
62.2
10
Banque Cantonale Vaudoise (BCV)
Cantonal Bank
61.6
11
Basler Kantonalbank
Cantonal Bank
57.4
12
St.Galler Kantonalbank AG
Cantonal Bank
48.1
13
Union Bancaire Privée (UBP) SA
Private Bank / Wealth Management
47.9
14
Berner Kantonalbank AG (BEKB)
Cantonal Bank
43.0
15
Aargauische Kantonalbank
Cantonal Bank
41.9
16
EFG Bank AG
Private Banking Group
39.4
17
Valiant Bank AG
Regional / Retail Bank
37.9
18
Basellandschaftliche Kantonalbank
Cantonal Bank
37.6
19
Graubündner Kantonalbank
Cantonal Bank
36.3
20
Thurgauer Kantonalbank
Cantonal Bank
36.0
21
Banque Cantonale de Genève (BCGE)
Cantonal Bank
34.9
22
Banque Cantonale de Fribourg
Cantonal Bank
29.5
23
Schwyzer Kantonalbank
Cantonal Bank
24.2
24
Bank Vontobel AG
Investment & Wealth Management
22.9
25
Banque Cantonale du Valais
Cantonal Bank
22.0
Key Structural Highlights
UBS Group Dominance: Following the absorption and operational integration of Credit Suisse, UBS entities (UBS AG & UBS Switzerland AG) represent roughly 35–40% of total Swiss banking assets.
Cantonal Banks: State-backed regional public banks (such as ZKB, BCV, LUKB) make up more than half of the top 25 institutions, holding approximately a quarter of the entire nation’s banking assets.
Private Wealth Management: Pure-play wealth managers like Julius Bär, UBP, EFG, and Vontobel rank high in client assets under management (AUM), even if their balance sheet total assets appear smaller than regional retail lenders.
What is the difference between UBS AG and UBS Switzerland AG?
The primary difference between UBS AG and UBS Switzerland AG lies in their scope of operations, corporate hierarchy, and regulatory mandate within the broader UBS Group structure.
Core Differences
Feature
UBS AG
UBS Switzerland AG
Primary Scope
Global banking operations
Swiss domestic banking market
Role in Hierarchy
Primary global operating subsidiary under holding company UBS Group AG
Direct legal subsidiary of UBS AG
Key Businesses
Wealth Management, Global Investment Banking, Asset Management
Subject to Swiss (FINMA) and foreign regulators (SEC, PRA, HKMA, etc.)
Ring-fenced Swiss Systemically Important Bank (SIBN)
Target Clients
International high-net-worth individuals, global corporations, institutions
Domestic Swiss households, local small-to-medium enterprises (SMEs), pensions
Key Structural & Operational Distinction
1. Corporate Hierarchy
UBS Group AG: The overarching public holding company listed on the SIX Swiss Exchange and the NYSE.
UBS AG: The main operating bank that owns domestic and international subsidiaries (such as US branches, Asian entities, and UK operations).
UBS Switzerland AG: A dedicated ring-fenced bank that operates under a distinct Swiss banking license, owned by UBS AG.
2. Regulatory Purpose («Too Big to Fail»)
UBS Switzerland AG was spun off as a distinct legal entity in 2015 due to Swiss «Too Big to Fail» (TBTF) legislation.
Protection of Domestic Services: By legally separating the core domestic functions (Swiss savings, corporate lending, payment systems, and mortgages) into UBS Switzerland AG, Swiss regulators (FINMA and SNB) ensured that if the global investment bank or international arms faced financial distress, the Swiss domestic banking economy could continue operating independently.
3. Client & Geographic Focus
UBS AG handles international client capital, investment banking activities globally, and cross-border financial market operations.
UBS Switzerland AG services domestic Swiss customers—ranging from everyday personal accounts and private mortgages to mid-market corporate financing across Swiss cantons.
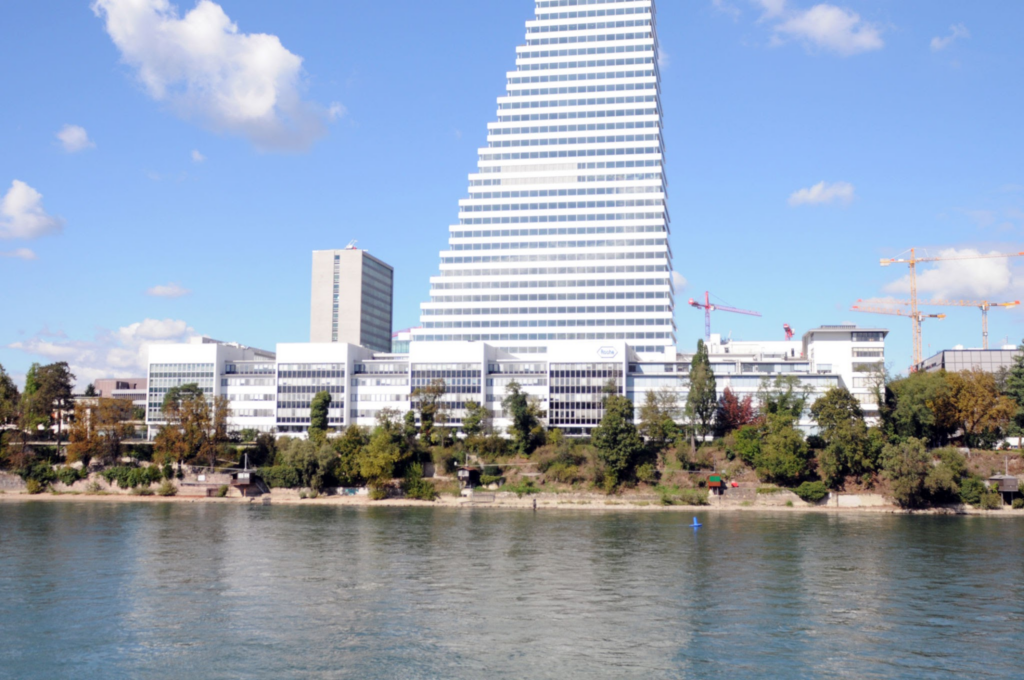
F. Hoffmann-La Roche AG, commonly known as Roche, is a Swiss multinational healthcare giant headquartered in Basel, Switzerland. Founded in 1896 by Fritz Hoffmann-La Roche, it is one of the world’s largest pharmaceutical companies and the global leader in cancer treatments and in-vitro diagnostics.
Roche headquarters in Basel, Switzerland. Bron: Rafael_Wiedenmeier / Getty Images
Core Business Divisions
Roche operates under two primary global divisions:
Pharmaceuticals: Focuses heavily on biotechnology, oncology, immunology, ophthalmology, infectious diseases, and neuroscience. Major blockbusters include Ocrevus (multiple sclerosis), Hemlibra (hemophilia A), Tecentriq (cancer immunotherapy), and historical oncology anchors Herceptin, Avastin, and Rituxan.
Diagnostics: Develops diagnostic instruments, assays, and digital solutions for hospitals, laboratories, and point-of-care testing. It is a market leader in molecular diagnostics, tissue pathology, and blood glucose monitoring (Accu-Chek).
Strategic Milestones & Structure
Genentech Acquisition: Roche acquired full ownership of US biotech pioneer Genentech in 2009 for $46.8 billion, making Genentech its primary US research hub and core engine for biological medicines.
Personalized Healthcare: Roche pioneered the combination of in-house diagnostic tools with targeted therapeutics, enabling healthcare providers to match treatments to patients‘ specific genetic profiles.
Ownership: The founding Hoffmann-Oeri family holds the controlling pool of voting bearer shares, maintaining long-term independence while non-voting equity shares (Genusstscheine) trade publicly on the SIX Swiss Exchange.
Did the genusstscheine of Roche improve in value over the last 5 years>
To evaluate the 5-year performance of Roche’s non-voting equity certificates (Genussscheine, ticker: ROG), it helps to distinguish between capital appreciation (share price movement) and total return (price appreciation plus reinvested dividends).
1. Capital Appreciation (Price Movement)
On a pure share price basis, Roche Genussscheine did not gain value compared to five years ago, though they have recovered significantly from their multi-year lows.
5 Years Ago (Mid-2021): Trading around CHF 350 – CHF 360.
Peak (Spring 2022): Reached an all-time high of over CHF 400 driven by COVID-19 diagnostics demand and pharmaceutical revenues.
Bottom (Early 2024): Dropped to around CHF 220 – CHF 245 due to the steep decline in post-pandemic COVID testing revenue, clinical trial setbacks, and Swiss franc strength.
Current Level (2026): Rebounded back to around CHF 330 – CHF 358.
Verdict on Nominal Price: The price is slightly below or roughly flat relative to 2021 levels (a modest loss to flat performance depending on the exact buying window in 2021).
2. Total Shareholder Return (TSR)
If you include dividend payouts, the investment yielded a positive total return:
Roche is a reliable dividend growth stock, having increased its payout for 38+ consecutive years.
Over the past 5 years, Roche paid out substantial cumulative dividends per non-voting certificate:
2021: CHF 9.30
2022: CHF 9.50
2023: CHF 9.60
2024: CHF 9.70
2025: CHF 9.80
Summing these cash payouts yields over CHF 47 per Genussschein in cash dividends alone over the 5-year holding period.
Summary
Price alone: Virtually flat to slightly down compared to 2021 levels.
Total Return (Price + Dividends):Improved in value thanks to a steady annual dividend yield of ~3–4%.
Gemini: Solar power makes up a significantly higher percentage of the electricity grid mix in the Netherlands than in Switzerland:
Country
Solar Share of Grid Electricity Mix
Primary Electricity Source
The Netherlands
~19% – 21%
Wind (~25–27%) & Natural Gas (~36%)
Switzerland
~12% – 13%
Hydropower (~55%)
Key Context & Differences
The Netherlands (Roof & Ground PV Leader): The Netherlands has one of the highest per-capita installed solar capacities in the world, driven by widespread rooftop installations on residential and commercial buildings. Combined with wind energy (~25–27%), wind and solar now generate roughly half of all Dutch electricity.
Switzerland (Hydro-Dominated): Switzerland’s grid relies primarily on hydroelectric power (55%) and nuclear energy (24%). While Swiss solar capacity is expanding rapidly to offset seasonal winter shortfalls and the planned phase-out of nuclear plants, it currently accounts for around 13% of generation.
(Note: These figures refer specifically to grid electricity generation. In terms of gross total energy consumption—which includes road transport fuels and building heat—solar accounts for roughly 5% in the Netherlands and 3–4% in Switzerland.)
Question: What is the best batterystorage, and how is it measured?
There is no single «best» battery storage system—the best option depends entirely on whether it is intended for a residential home, an electric vehicle, or a massive utility grid.
However, for stationary energy storage (home solar backup and electrical grids), Lithium Iron Phosphate (LFP) is widely considered the best overall technology due to its balance of safety, lifespan, and lower cost.
1. How Battery Storage Performance Is Measured
Battery systems are evaluated across seven core engineering metrics:
Capacity (kWh or MWh): The total amount of energy the battery can store. (e.g., a typical home battery holds 10–15 kWh; grid-scale installations store hundreds of MWh).
Power Output (kW or MW): How fast energy can be delivered at any given moment. (High power is required to start major appliances like heat pumps).
Round-Trip Efficiency (RTE): The percentage of energy retrieved relative to the amount put in. High efficiency means less power is lost as heat during charging and discharging.
Cycle Life & Degradation: How many full charge/discharge cycles a battery can complete before its initial capacity drops to 80%.
Depth of Discharge (DoD): The percentage of the battery’s capacity that can be safely used without accelerating degradation.
Volumetric & Gravimetric Energy Density (Wh/L or Wh/kg): How much energy fits within a specific physical space or weight. High energy density is critical for vehicles, but less important for home basements or grid fields.
Levelized Cost of Storage (LCOS): The true financial metric—calculating the total upfront cost plus maintenance, divided by the total energy the battery delivers over its operational lifetime (€/kWh delivered).
2. Comparison of the Leading Battery Technologies
Technology
Round-Trip Efficiency
Typical Cycle Life
Safety / Thermal Stability
Primary Best Use Case
Lithium Iron Phosphate (LFP)
90% – 95%
4,000 – 8,000+
Very High (hard to catch fire)
Home solar backup & grid-scale
Nickel Manganese Cobalt (NMC)
90% – 95%
1,500 – 3,000
Moderate (requires active cooling)
Electric Vehicles & electronics
Flow Batteries (e.g., Vanadium)
70% – 85%
15,000 – 20,000+
Maximum (non-flammable liquid)
Long-duration grid backup (8–24h+)
Sodium-Ion (Na-Ion)
85% – 90%
3,000 – 5,000
High (uses non-critical materials)
Budget grid storage & cold climates
3. Which Battery is «Best» for Each Application?
For Residential Home Solar: LFP (Lithium Iron Phosphate)
LFP is the clear winner for home systems. Because weight and size do not matter in a garage or utility room, LFP’s slightly lower energy density compared to EV batteries is irrelevant. In exchange, it offers extreme thermal stability (reducing fire risks) and can cycle daily for 15+ years before noticeable degradation.
For Short-Duration Grid Storage (1 to 6 Hours): LFP Systems
LFP accounts for the vast majority of grid-scale battery installations globally. High round-trip efficiency (~92%) ensures low energy loss during rapid energy arbitrage (charging during peak solar/wind, discharging during high demand).
For Multi-Day or Seasonal Grid Storage (8 to 24+ Hours): Flow Batteries
Flow batteries store energy in large tanks of liquid electrolyte. Though less efficient and more physically bulky than lithium, their energy capacity is expanded simply by building larger tanks. They do not suffer chemical degradation over time, making them far cheaper per kWh for long-duration storage.
Is there an example of battery storage for the grid?
One of the clearest real-world examples of grid-scale battery storage is the Moss Landing Energy Storage Facility in California, USA.
Rather than building dedicated new ground, developers converted an old, retired gas power plant into a massive Battery Energy Storage System (BESS).
Key Specifications of Moss Landing
Power Output: 500+ Megawatts (MW)
Energy Capacity: Over 2,000 Megawatt-hours (MWh)
Duration: ~4 hours of continuous discharge at maximum power.
Equivalent Impact: Can supply electricity to roughly 300,000 to 400,000 homes for several hours during high-demand periods.
How it Operates on the Grid
The system serves three primary functions for the California electrical grid:
Absorbing Solar «Over-Production» (Midday): California generates vast amounts of solar power around noon, often creating an oversupply. Moss Landing charges up during these peak sun hours when electricity is cheapest.
Discharging during the «Evening Ramp»: As the sun sets and solar generation drops, millions of people return home and turn on lights, air conditioning, and appliances. The battery discharges its stored energy back into the grid, replacing the need to fire up fast-acting gas «peaker» plants.
Frequency Regulation: Grid frequency must stay precisely at 60 Hz. The battery can respond in milliseconds to minor fluctuations in power demand or supply, keeping the voltage stable.
Why Old Power Plants Are Reused for Batteries
Reusing retired fossil-fuel plant sites (like Moss Landing in the US or Hazelwood in Australia) is becoming a standard trend for grid storage because:
Existing High-Voltage Grid Infrastructure: The sub-stations and high-voltage power lines are already in place, eliminating years of transmission line construction.
Industrial Zoning: The land is already permitted for heavy power infrastructure.
Other Notable Examples Worldwide
Victorian Big Battery (Geelong, Australia): Uses 212 Tesla Megapack units to back up high-voltage lines, preventing blackouts during hot summer peaks in southern Australia.
Oasis de Atacama (Chile): Designed to store excess solar power from the Atacama Desert to power urban centers hundreds of kilometers away.
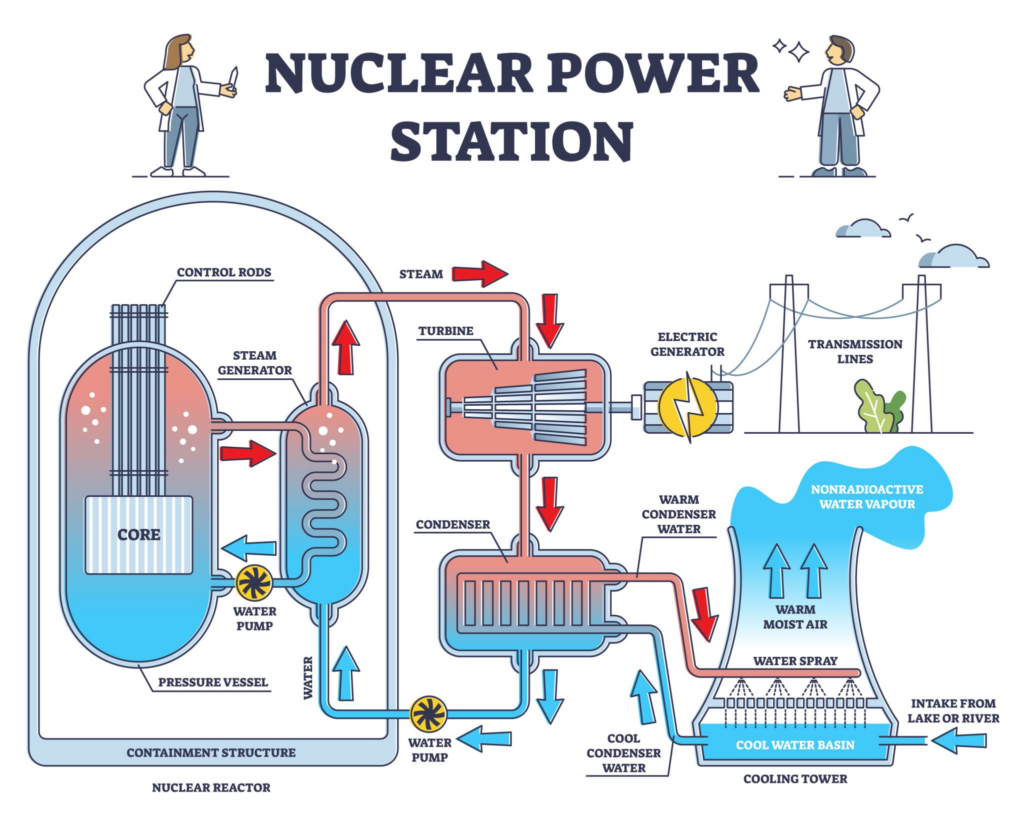
Gemini: While nuclear power produces massive amounts of continuous energy on a small land footprint, it carries a unique set of technical, environmental, and financial risks.
Containment structures seal the reactor core from the external environment.. Bron: VectorMine / Getty Images
Key Dangers and Challenges
1. Severe Core Accidents and Radioactive Release
The most severe technical hazard is a loss-of-coolant accident leading to a core meltdown (as occurred at Chernobyl and Fukushima).
Decay Heat: Even after a reactor shuts down, radioactive fission products continue generating heat. If active cooling fails, temperatures escalate, melting fuel rods and potentially breaching the containment vessel.
Environmental Fallout: Radiation leaks can contaminate water supplies, land, and ecosystems, requiring multi-decade exclusion zones and costly cleanup operations.
2. High-Level Radioactive Waste Storage
Nuclear fission generates spent fuel assemblies containing isotopes like Plutonium-239 and Technetium-99, which remain dangerous for tens to hundreds of thousands of years.
Long-Term Geological Storage: Permanent solutions—deep geological repositories like Finland’s Onkalo—are technically feasible but politically difficult to implement.
Interim Cooling: Most spent fuel is stored on-site in cooling pools or dry casks, leaving it vulnerable to long-term storage risks if permanent disposal is delayed.
3. Geopolitical, War, and Security Vulnerabilities
Nuclear facilities are high-value targets during armed conflicts or geopolitical crises.
Direct Targeting & Power Disruption: War near active reactors (such as the Zaporizhzhia plant in Ukraine) risks power grid disconnection, disrupting active cooling systems.
Proliferation Risk: The enrichment technologies used to produce reactor fuel (specifically uranium enrichment and spent fuel reprocessing) can potentially be diverted toward weapons-grade materials.
4. Financial and Construction Overrun Risks
While not a physical hazard, economic risk is often the primary reason nuclear projects stall.
Capital Intensity: Reactors cost billions of euros upfront and take 10 to 15 years to build.
Cost Overruns: Modern European reactors (such as Olkiluoto 3 in Finland or Flamanville 3 in France) experienced years of delays and budget overruns, making private financing difficult without state guarantees.
Statistical Context & Modern Mitigations
Despite these hazards, modern Generation III+ reactors incorporate passive safety systems that rely on gravity and natural convection to cool the core without external electricity or human intervention. Statistically, on a deaths-per-terawatt-hour (TWh) basis—including historical disasters—nuclear energy remains among the safest power sources, comparable to wind and solar and orders of magnitude safer than coal or oil air pollution.
Want to compare the mortality rate per TWh of nuclear against fossil fuels and renewables?
Yes please
According to global energy research compiled by Our World in Data (drawing on peer-reviewed studies by Markandya & Wilkinson, Sovacool et al., and UNSCEAR), the differences in mortality rates per unit of electricity generated are dramatic.
Mortality estimates account for both air pollution (which causes chronic respiratory and cardiovascular illnesses) and accidents across the supply chain (mining, transport, construction, maintenance, and plant operation).
Mortality Rates per Terawatt-Hour (TWh)
1 TWh is roughly the annual electricity consumed by 150,000 European citizens.
Energy Source
Estimated Deaths per TWh
Main Cause of Mortality
Brown Coal (Lignite)
32.72
Severe localized air pollution & dangerous mining
Coal
24.62
Particulate air pollution & coal mining accidents
Oil
18.43
Air pollution & extraction/refining hazards
Biomass
4.63
Indoor and outdoor particulate pollution
Natural Gas
2.82
Air pollution & pipeline/extraction accidents
Hydropower
1.30(~0.04 baseline)
Dam failures (dominated by the 1975 Banqiao Dam collapse)
Wind
0.04
Maintenance accidents (e.g., falls, offshore drowning)
Nuclear
0.03
Major historical accidents (includes Chernobyl & Fukushima)
Solar
0.02
Roof falls during installation & supply chain accidents
Key Takeaways
Fossil Fuels Kill via Air Pollution: The overwhelming majority of energy-related deaths do not come from sudden industrial disasters, but from silent, chronic particulate pollution generated by burning coal, oil, and gas.
Nuclear, Wind, and Solar are Orders of Magnitude Safer: Nuclear power causes over 99.8% fewer deaths than coal and 98.9% fewer deaths than natural gas per unit of energy produced.
Statistical Perception Gap: Public fear of nuclear energy is driven by rare, high-visibility disasters (Chernobyl, Fukushima). In contrast, fossil fuel mortality occurs continuously and invisibly every day.
Can we look at the cost to build and maintain one nuclear reactor?
Evaluating the cost of a single nuclear reactor involves separating the upfront construction cost (CAPEX) from the ongoing operational cost (OPEX) and long-term decommissioning.
Nuclear energy is defined by an extreme cost structure: 70%–80% of the total lifetime cost is locked in before the reactor generates its first kilowatt-hour.
1. Upfront Capital Cost (CAPEX) to Build
The total cost to construct a single large commercial reactor (~1,000 to 1,600 MW) varies drastically depending on the country, regulatory environment, and construction delays.
«Overnight» Construction Cost: This is the base cost of materials, engineering, and labor assuming zero interest during construction.
Western Nations (FOAK – First-of-a-Kind): $6,000 to $10,000+ per kW of capacity. A single 1,000 MW reactor costs $6 billion to $10+ billion in base physical build costs alone.
Standardized / Serial Builds (e.g., South Korea, China): $2,200 to $3,500 per kW. A single 1,000 MW reactor costs $2.2 billion to $3.5 billion.
Financing & Interest During Construction (The «Capital» Trap): Because nuclear plants take 7 to 15 years to build, compound interest on multi-billion-dollar loans during construction often adds 30% to 50% to the final price tag before opening.
Real-World Western Benchmarks (Recent Projects)
Plant Vogtle Units 3 & 4 (USA): ~$35 billion combined (~$17.5 billion per 1,100 MW AP1000 reactor) due to massive delay-related financing costs.
Olkiluoto 3 (Finland): ~€11 billion (~$12 billion) for a single 1,600 MW EPR reactor, up from an initial estimate of €3.3 billion.
Hinkley Point C (UK): Estimated £31 billion–£35 billion for two 1,600 MW EPR reactors (~$20 billion+ per reactor).
2. Maintenance & Operating Costs (OPEX)
Once a reactor is operational, it is relatively cheap to run and benefits from a high capacity factor (~90%+ uptime).
Average Generating Cost: ~$31 to $37 per MWh produced (US fleet average). For a single 1,000 MW reactor running 24/7, this translates to roughly $250 million to $320 million per year in total operational expenditures.
Cost Breakdown of OPEX:
Operations & Maintenance (O&M): ~60%–70% of OPEX. High labor expenses for specialized engineers, security teams, continuous safety inspections, and periodic refuel outages.
Fuel Costs: ~15%–20% of OPEX. Uranium supply, enrichment, and fabrication are relatively cheap relative to total output, making nuclear far less sensitive to fuel price spikes than gas or coal.
Capital Additions / Maintenance Upgrades: ~15%–20% of OPEX. Regular replacement of pumps, steam generators, and digital control systems over a 40- to 60-year lifespan.
3. End-of-Life: Decommissioning & Waste Storage
Decommissioning: Dismantling a contaminated reactor core and site restoration costs $500 million to $1.5 billion per reactor. Utilities are required by law in most countries to accumulate this money during the reactor’s operating life into a dedicated decommissioning fund (typically charging ~$0.001 to $0.002 per kWh).
Gemini: ABB (Asea Brown Boveri) is a Swiss-Swedish multinational technology leader headquartered in Zurich, Switzerland. Formed in 1988 through the merger of Sweden’s ASEA and Switzerland’s Brown, Boveri & Cie, ABB operates in four core global business areas:
Electrification: Smart power distribution, EV charging infrastructure, solar inverters, and medium/low-voltage power systems.
Motion: Motors, generators, and electric drives that power industrial processes and transportation efficiently.
Process Automation: Measurement, analytics, control systems, and digital solutions for heavy industries (marine, mining, energy, pharmaceuticals).
Robotics & Discrete Automation: Industrial robots, autonomous mobile robots (AMRs), and machine automation solutions.
5-Year Investment Return Analysis
Yes, an investment in ABB five years ago would have yielded a major profit.
Over the past five years, ABB’s stock experienced significant growth driven by structural demand in grid modernization, industrial automation, energy efficiency, and data center infrastructure.
Stock Performance Breakdown
Metric
SIX Swiss Exchange (ABBN)
NYSE / US ADR (ABBNY)
Share Price (Aug 2021)
~32.38 CHF
~$34.50 USD
Share Price (Aug 2026)
~80.08 CHF
~$103.30 USD
Capital Growth
+147%
+199%
Total Return (incl. Dividends)
>160%
>215%
What Drove the Growth?
Portfolio Streamlining: Under CEO Björn Rosengren and subsequent leadership, ABB shifted to a decentralized operating model («ABB Way»), shedding lower-margin businesses (like Power Grids to Hitachi) to focus on high-margin automation and electrification.
Energy Transition Tailwinds: Surge in global demand for electric vehicle charging, renewable grid connections, and energy-efficient industrial motors.
Data Center & Infrastructure Boom: Heavy adoption of ABB’s power distribution equipment to support power-hungry data centers and AI computing infrastructure worldwide.
Question: What about Swisscom, also what one would have made the last 5 years
About Swisscom AG
Swisscom is Switzerland’s leading telecommunications provider and a state-backed digital services giant. The Swiss Confederation holds a mandatory majority stake (51%) in the company.
Key Operational Focus Areas
Consumer Telecommunications: Market leader in Swiss mobile, fixed-line broadband, and TV/entertainment services.
Enterprise & IT Services: Cloud infrastructure, cybersecurity, enterprise networking, and digital transformation services for Swiss businesses and government agencies.
International Expansion: Swisscom owns Fastweb in Italy and acquired Vodafone Italia (a major €8 billion deal announced in 2024 to merge Fastweb with Vodafone’s Italian operations).
5-Year Investment Return Analysis
Yes, an investment in Swisscom five years ago would have yielded a modest profit, largely driven by high dividend payouts rather than rapid capital growth.
Unlike high-growth tech or industrial stocks, Swisscom is widely treated as a defensive, bond-like equity — offering stable income with low volatility.
Stock Performance Breakdown (August 2021 – August 2026)
Metric
SIX Swiss Exchange (SCMN)
US ADR (SCMWY)
Share Price (Aug 2021)
~CHF 544.00
~$60.00 USD
Share Price (Aug 2026)
~CHF 622.00
~$76.75 USD
Capital Growth (Price Return)
+14.3%
+27.9%
Total Return (incl. Reinvested Dividends)
+39.3%
+52.0%
Annualized Total Return
~6.85% per year
~8.7% per year
What Drove These Returns?
High Dividend Yield: Swisscom routinely pays a dividend yield between 4% and 5%. The bulk of a shareholder’s profit over any 5-year window comes from these steady payouts rather than dramatic stock price surges.
Defensive Market Position: High market share and a stable regulatory environment in Switzerland allow Swisscom to maintain strong pricing power and high margins.
Currency Impact for US/International Investors: Because the Swiss Franc (CHF) appreciated relative to the US Dollar over this period, USD-denominated returns were higher than local CHF returns.
Gemini: When ranking the top 20 companies in Switzerland, market capitalization (total market value) is the standard benchmark.
Switzerland hosts several global heavyweights relative to its size, particularly in pharmaceuticals, financial services, consumer goods, and industrial automation.
Top 20 Swiss Companies by Market Capitalization
Rank
Company
Sector / Industry
Headquarters
1
Roche
Pharmaceuticals & Diagnostics
Basel
2
Novartis
Pharmaceuticals & Biotech
Basel
3
Nestlé
Food & Beverage / Consumer Goods
Vevey (Vaud)
4
ABB
Industrial Automation & Electrification
Zurich
5
UBS Group
Investment Banking & Wealth Management
Zurich / Basel
6
Richemont(Chloé, Cartier)
Luxury Goods & Watchmaking
Bellevue (Geneva)
7
Chubb
Global Insurance
Zurich
8
Zurich Insurance Group
Insurance & Financial Services
Zurich
9
Glencore
Mining & Commodity Trading
Baar (Zug)
10
Galderma Group
Dermatology & Skincare
Zug
11
Swiss Re
Reinsurance
Zurich
12
Lonza Group
Life Sciences & Contract Manufacturing
Basel
13
Holcim
Building Materials & Concrete
Zug
14
Swisscom
Telecommunications
Ittigen (Bern)
15
Givaudan
Flavors & Fragrances
Vernier (Geneva)
16
Sika
Specialty Chemicals & Construction
Baar (Zug)
17
Sandoz Group
Generics & Biosimilars
Basel
18
Alcon
Eye Care & Ophthalmic Devices
Geneva
19
Schindler Group
Elevators & Escalators
Ebikon (Lucerne)
20
Swiss Life Holding
Life Insurance & Asset Management
Zurich
Notable Non-Listed & Revenue Giants
If ranking strictly by annual revenue rather than public stock valuation, the top list shifts significantly to include privately held commodity trading giants:
Vitol & Trafigura (Geneva): Giant commodity trading houses that generate tens or hundreds of billions in annual revenue, but remain unlisted.
Rolex (Geneva): Privately held by a foundation, making it one of the most valuable luxury brands globally despite not having a public market capitalization.
Question: What about the Netherlands?
When ranking the top 20 companies in the Netherlands by market capitalization, the landscape is heavily dominated by semiconductor technology, global tech investment, aerospace, and financial services.
Because of the Netherlands‘ favorable corporate and tax framework, several major multinational giants maintain their legal headquarters or primary stock listings in Amsterdam (on Euronext Amsterdam) alongside classic Dutch heavyweights.
Top 20 Dutch Companies by Market Capitalization
Rank
Company
Sector / Industry
Headquarters / Main Operations
1
ASML
Semiconductor Equipment (Lithography)
Veldhoven
2
Prosus
Consumer Internet & Tech Investment
Amsterdam
3
Airbus
Aerospace & Defense
Leiden (Legal HQ)
4
ING Group
Banking & Financial Services
Amsterdam
5
NXP Semiconductors
Automotive & Industrial Chips
Eindhoven
6
Argenx
Immunology & Biotechnology
Amsterdam / Ghent
7
ASM International
Semiconductor Wafer Processing
Almere
8
Heineken
Beverages / Brewing
Amsterdam
9
Ahold Delhaize
Supermarkets & Food Retail
Zaandam
10
Universal Music Group (UMG)
Music & Entertainment
Hilversum
11
Adyen
Financial Technology & Payments
Amsterdam
12
Royal Philips
Health Technology & Medical Devices
Amsterdam
13
ABN AMRO
Commercial Banking
Amsterdam
14
Exor
Holding Company (Stellantis, Ferrari)
Amsterdam
15
Wolters Kluwer
Professional Information & Software
Alphen aan den Rijn
16
KPN
Telecommunications
Rotterdam
17
NN Group
Insurance & Asset Management
The Hague
18
HAL Trust
Investment Holding
Rotterdam
19
DSM-Firmenich
Health, Nutrition & Biosciences
Maastricht / Kaiseraugst
20
Randstad
HR & Staffing Services
Diemen
Key Takeaways on the Dutch Corporate Landscape
Semiconductor Superpower: The Brainport Eindhoven region anchors a massive chip equipment ecosystem. ASML alone accounts for a massive portion of the entire AEX benchmark index value.
Global Corporate Restructuring: Historically dual-listed giants like Shell and Unilever moved their single primary corporate headquarters and listings exclusively to the UK in recent years, though both still maintain heavy operational footprints and AEX index weightings in Amsterdam.
Multinational Holdings: Major industrial groups (like Stellantis, Airbus, and Exor) choose corporate domicile in the Netherlands due to its flexible corporate law structure and central European location.
Gemini: Yes, Switzerland currently operates three commercial nuclear power plants containing a total of four nuclear reactors. Together, they generate roughly 30% to 35% of the country’s electricity.
Operating Nuclear Power Plants
Plant
Location (Canton)
Reactors
Operational Since
Notes
Beznau
Aargau
Beznau 1 & Beznau 2
1969 (Unit 1) / 1971 (Unit 2)
Beznau 1 is the world’s oldest commercially operating nuclear power plant.
Gösgen
Solothurn
1 Reactor
1979
Also supplies district heating to nearby homes and industrial facilities.
Leibstadt
Aargau
1 Reactor
1984
Switzerland’s newest and most powerful reactor.
Decommissioned & Inactive Plants
Mühleberg (Bern): Permanently shut down in December 2019 for economic reasons. It is currently undergoing a multi-year decommissioning process.
Lucens (Vaud): An experimental underground reactor that experienced a partial core meltdown in 1969; it was subsequently closed, decontaminated, and decommissioned.
What is Switzerland’s Policy on Nuclear Power?
Unlimited Lifespans (Subject to Safety): Unlike some countries with hard operational deadlines, Swiss reactors are legally licensed to operate as long as they meet strict safety standards set by the Federal Nuclear Safety Inspectorate (ENSI). The operators of Beznau plan to run the units into the early 2030s.
Phase-out Initiative (2017): Following the 2011 Fukushima disaster, Swiss voters approved Energy Strategy 2050 in 2017, which banned the construction of new nuclear power plants while allowing existing ones to run until their end-of-life.
Re-evaluating the Ban: Driven by geopolitical energy uncertainty, climate goals, and rising winter electricity demand, the Swiss Federal Council proposed lifting the ban on constructing new nuclear power plants to keep nuclear energy as a long-term option for grid stability.
Gemini: Yes, heavily. Grid congestion (netcongestie) is currently one of the single largest economic, infrastructure, and energy challenges facing the Netherlands.
Nearly every province across the country now faces severe capacity bottlenecks on both electricity consumption (off-take) and generation (feed-in).
Why Is the Dutch Grid Congested?
The Dutch electricity grid was originally built for a centralized energy model: a few large fossil-fuel power plants supplying power one-way to homes and factories. The rapid shift toward renewable energy and electrification has outpaced the physical capacity of the high- and medium-voltage networks managed by national grid operator TenneT and regional operators like Liander, Enexis, and Stedin.
Key drivers include:
Rapid Electrification: Massive surges in heat pumps, electric vehicle (EV) charging infrastructure, industrial electrification, and data centers drastically increasing demand for power off-take.
Distributed Renewable Generation: Unprecedented adoption of solar panels (on homes, commercial roofs, and solar parks) and wind farms feeding large peaks of variable power back into local grids.
Permitting & Construction Delays: Upgrading power lines, building high-voltage substations, and laying new cables take years due to complex environmental permitting, land-use approvals, and severe shortages of specialized technical labor.
What Are the Real-World Impacts?
Waitlists for Businesses: Thousands of businesses looking to expand, build new facilities, or set up new connections are placed on waiting lists for power connections, sometimes waiting years for grid capacity.
Housing & Public Projects: In certain regions, new residential developments, schools, and hospitals face delays or cannot install fast-charging infrastructure or full heat-pump systems without local grid workarounds.
Curtailment of Renewable Energy: Solar parks and wind farms are occasionally instructed to reduce or shut off generation during peak hours because the grid cannot transport the electricity.
Solutions Underway
To address the bottleneck, national and regional actors are pursuing several parallel strategies:
Grid Expansion: Massive infrastructure investment by TenneT and regional grid operators to lay thousands of kilometers of new cables and expand substations.
Congestion Management & Flexible Contracts: Offering lower tariffs or financial incentives to large industrial consumers who agree to adjust their usage during peak hours (spitsstroom).
Energy Hubs & Local Storage: Combining solar, wind, battery energy storage systems (BESS), and smart microgrids directly at business parks to balance supply and demand locally without burdening the main grid.
Question: what about switzerland?
Yes, but in a very different way.
While the Netherlands struggles with widespread local distribution bottlenecks that lock businesses out of the grid, Switzerland’s grid congestion (Netzengpässe) is primarily a high-voltage transmission and cross-border transit issue.
1. Main Drivers of Swiss Grid Congestion
International Transit Flows & Lack of EU Bilateral Agreement
Switzerland is the «electricity hub of Central Europe,» geographically surrounded by Germany, France, Italy, and Austria. Large amounts of power flow across Swiss borders depending on European market dynamics (e.g., German wind power flowing south, or French nuclear moving east/west).
Because Switzerland is not an EU member state and currently lacks an official Bilateral Electricity Agreement with the EU, Swissgrid (the national grid operator) is excluded from automated EU market-coupling mechanisms. This leads to unscheduled power flows (loop flows) across the Swiss grid, forcing Swissgrid to frequently order redispatching—artificially throttling down some power plants and ramping up others to keep transmission lines from overheating.
Rising Strain: Redispatch intervention volume by Swissgrid jumped from 170 GWh to over 660 GWh in recent years to keep high-voltage lines stable.
The «Winter Gap» & Seasonal Imbalances
Switzerland experiences a sharp seasonal mismatch between electricity supply and demand:
Summer: High solar and alpine snowmelt drive massive hydropower generation, resulting in large electricity surpluses that must be exported or used for pumped storage.
Winter: Hydropower production drops significantly while heating and lighting demand peaks. Switzerland must import heavy volumes of electricity from neighboring countries, heavily stressing cross-border interconnectors.
Topography & Decentralized Solar
Expanding high-voltage transmission lines through the Swiss Alps is extraordinarily slow and expensive due to strict environmental protections, landscape conservation rules, and difficult terrain. At the local level, the rapid surge in rooftop and alpine solar is starting to create localized feed-in peaks during sunny summer days.
2. Netherlands vs. Switzerland: Key Differences
Feature
Netherlands 🇳🇱
Switzerland 🇨🇭
Primary Bottleneck
Local & Regional Distribution (Medium/Low Voltage)
High-Voltage Transmission & Borders (220/380 kV)
Biggest Impact
Commercial waitlists; new buildings/EV chargers denied grid connections
Alpine corridors, high transit flow from surrounding EU states
Policy Hurdle
Permitting speed & labor shortages for cable-laying
EU non-integration and lack of a bilateral energy treaty
3. How Switzerland Is Addressing It
The Electricity Act (Stromgesetz): Approved by voters in 2024, this legislation aims to boost domestic winter electricity generation (via alpine solar, wind, and expanded hydro storage) to reduce reliance on winter imports.
Strategic Grid Expansion: Swissgrid is executing long-term grid updates (Strategic Grid 2040) to replace aging 220 kV lines with higher-capacity 380 kV corridors.
EU Negotiations: Switzerland continues political negotiations with the EU to establish an institutional framework for energy trade, which would grant Swissgrid access to coordinated European congestion management tools.